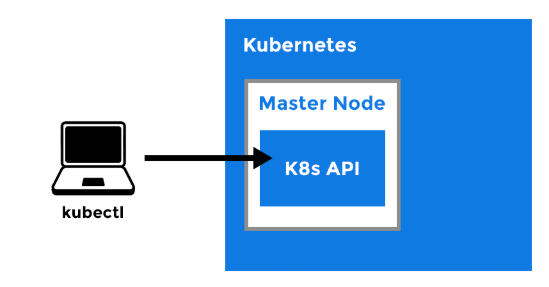
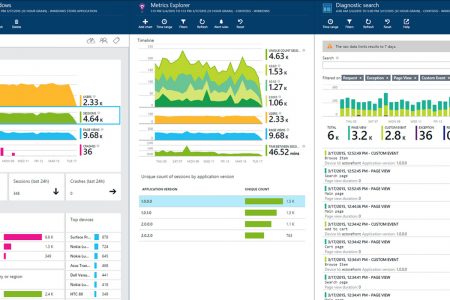
Sitecore sends what you would expect (errors, warnings, info logs) to Application Insights from a log perspective. In Application Insights, you can identify error and warning messages, identify messages from specific roles and Sitecore instances, and search for specific log messages.
For further information related to Sitecore logs, you can refer this Sitecore document: Analyze Sitecore logs with Application Insights and Sitecore KB Access logs and diagnostics data in Sitecore XP on Azure Web Apps
Below are the necessary Application Insights queries which might help you during the troubleshooting sessions of your Sitecore application:
Availability Results:
availabilityResults
| where timestamp > ago(7d)
| summarize avg(toint(success)) * 100 by bin(timestamp, 1h), name
| order by timestamp asc
| render timechart
Get unique users per day past 90 days:
union pageViews,customEvents
| where timestamp > ago(90d)
| summarize Users=dcount(user_Id) by bin(timestamp, 1d)
| render timechart
Get 500 errors in dependencies line graph past 90 days:
dependencies
| where timestamp > ago(90d)
| where resultCode in (\"500\", \"502\")
| summarize count() by bin(timestamp, 1d)
| render timechart
Get 404 errors in requests line graph past 90 days:
requests
| where timestamp > ago(90d)
| where client_Type != \"Browser\"
| where resultCode == 404
| summarize failedCount=sumif(itemCount, success == false) by bin(timestamp, 1d), resultCode
| extend request=\'Overall\'
| render timechart
Get server exceptions line graph past 90 days:
exceptions
| where timestamp > ago(90d)
| where client_Type != \"Browser\"
| summarize count() by bin(timestamp, 1d)
| render timechart
Get all exceptions bar chart past 90 days:
exceptions
| where timestamp > ago(90d)
| summarize count = sum(itemCount) by bin(timestamp, 4h), problemId, tostring(customDimensions.InstanceName)
| order by timestamp desc
| render barchart
Clientside and react errors line graph past 90 days:
exceptions
| where timestamp > ago(90d)
| where client_Type == \"Browser\"
| summarize count() by bin(timestamp, 1d)
| render timechart
Get WARN total count line graph past 90 days:
traces
| where timestamp > ago(90d)
| where severityLevel == 2
| parse message with * \"WARN\" TrimmedMessage
| summarize count() by bin(timestamp, 1d)
| render timechart
Get Trace ERROR total count line graph past 90 days:
traces
| where timestamp > ago(90d)
| where severityLevel == 3
| parse message with * \"ERROR\" TrimmedMessage
| summarize count() by bin(timestamp, 1d)
| render timechart
Get pageviews line graph past 90 days:
pageViews
| where timestamp > ago(90d)
| summarize count() by bin(timestamp, 1d)
| render timechart
Check your CD(s) for errors:
traces
| where timestamp > ago(1d)
| where message contains \"ERROR\"
| where (customDimensions).Role contains \"CD\"
| project timestamp, message, (customDimensions).InstanceName
| order by timestamp desc
To create a better overview on ERRORS you could extend the timespan and render the query using, for example, a timechart.
traces
| where timestamp > ago(144h)
| where message contains \"ERROR\"
| where (customDimensions).Role contains :CD\"
| extend localTime = timestamp + 1h
| summarize Amount_Of_Errors=dcount(message) by bin(localTime, 1h)
| order by localTime asc
| render timechart
Check your CM(s) for errors:
traces
| where timestamp > ago(1d)
| where message contains \"ERROR\"
| where (customDimensions).Role contains \"CM\"
| project timestamp, message, (customDimensions).InstanceName
| order by timestamp desc
Check all instances for errors:
traces
| where timestamp > ago(1d)
| extend localTime = timestamp + 1h
| where message contains \"ERROR\"
| where message !contains \"INFO\" and message !contains \"WARN\"
| project localTime, message, (customDimensions).InstanceName
| order by localTime desc
Check your environment on exceptions:
exceptions
| where timestamp > ago(14d)
| extend localTime = timestamp + 1h
| project localTime, (customDimensions).MachineName, assembly, outerMessage
Check your environment on server side exceptions:
exceptions
| where timestamp > ago(7d)
| where client_Type != \"Browser\"
| summarize Total = count() by problemId
| order by Total
| project Total, problemId
| take 10
Get server exceptions total count:
exceptions
| where timestamp > ago(7d)
| where client_Type != \"Browser\"
| summarize count()
Get client side exceptions:
exceptions
| where timestamp > ago(7d)
| where client_Type == \"Browser\"
| summarize Total = count() by problemId
| order by Total
| project Total, problemId
| take 10
Get client side exceptions total count:
exceptions
| where timestamp > ago(7d)
| where client_Type == \"Browser\"
| summarize count()
Get WARN count by occurrence:
traces
| where timestamp > ago(7d)
| where severityLevel == 2
| parse message with * \"WARN\" TrimmedMessage
| project TrimmedMessage, customDimensions.Role
| summarize Total = count() by TrimmedMessage, tostring(customDimensions_Role)
| order by Total
| project Total, customDimensions_Role, TrimmedMessage
| take 10
Get WARN total count:
traces
| where timestamp > ago(7d)
| where severityLevel == 2
| parse message with * \"WARN\" TrimmedMessage
| summarize count()
Get Trace ERROR count by occurrence:
traces
| where timestamp > ago(7d)
| where severityLevel == 3
| parse message with * \"ERROR\" TrimmedMessage
| project TrimmedMessage, customDimensions.Role
| summarize Total = count() by TrimmedMessage, tostring(customDimensions_Role)
| order by Total
| project Total, customDimensions_Role, TrimmedMessage
| take 10
Get TRACE ERROR total count:
traces
| where timestamp > ago(7d)
| where severityLevel == 3
| parse message with * \"ERROR\" TrimmedMessage
| summarize count()
Check your environment on log entry’s with severity > 3:
traces |
where severityLevel >= 3
What are the most hit Urls:
requests
| where timestamp > ago(14d)
| summarize count() by url
| order by count_ desc | project url, count_
Give me all 404 status codes:
requests
| where timestamp > ago(14d)
| extend localTime = timestamp + 1h
| where resultCode == \"404\"
| order by localTime desc
and summarize the Urls including a count
requests
| where timestamp > ago(14d)
| where resultCode == \"404\"
| summarize count() by url
| order by count_ desc | project url, count_
Check Sitecore license misconfigurations
traces
| where timestamp > ago(7d)
| where message contains \"license\" and severityLevel > 1
How many unique sessions hit my environment:
pageViews
| where timestamp > ago(7d)
| summarize TotalUniqueSessions = dcount(session_Id) by bin(timestamp, 1d)
| order by timestamp asc
| render barchart kind=default
Top 10 – Most requested pageviews:
pageViews
| where timestamp > ago(7d)
| summarize count() by url
| order by count_ desc | project url, count_
| take 10
Top 10 – Most requested pageviews (combined UA and City):
pageViews
| where timestamp > ago(7d)
| summarize count() by url, client_Browser, client_City, client_CountryOrRegion
| order by count_ desc | project url, count_, client_Browser, client_City, client_CountryOrRegion
| take 10
Top 10 – 404 resultCodes:
requests
| where resultCode == 404
| where timestamp > ago(7d)
| summarize count() by url
| order by count_ desc
| take 10
Top 10 – 500 Errors in dependencies:
dependencies
| where resultCode in (\'500\', \'502\')
| where timestamp > ago(7d)
| summarize count() by name, resultCode, target, type
| project name, resultCode, target, type, count_
| order by count_ desc
| take 10
CPU Usage:
performanceCounters
| where timestamp > ago(@{variables(\'timestamp\')})
| where category == \'Processor\'
| where counter == \'% Processor Time\'
| where instance == \'_Total\'
| summarize avg(value) by bin(timestamp, 1h), cloud_RoleInstance
| order by timestamp asc
| render timechart