Capture App Service Memory Dump

Debugging your application’s intermittent issues are really challenging in Azure App Service & sometimes Application Insights is not enough to provide you the solution. Depending upon your scenarios, retrieving & analyzing memory dump could be possible way to determine the root cause of the issue.
Refer the below steps to capture the memory dump:

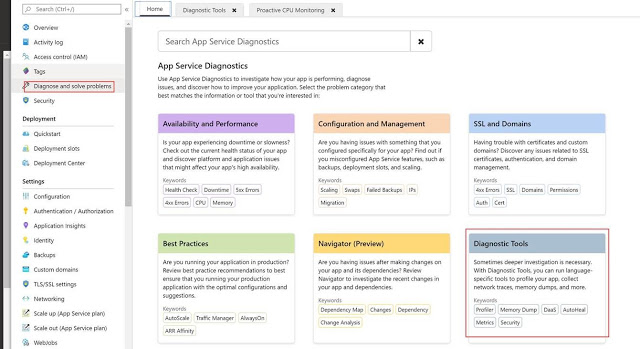
1. Go to “Diagnose and solve problems” -> “Diagnostic Tools”:
2. Choose “collect Memory Dump”:
3. Choose a suitable place to save the dump file:
4. Then collect the dump file:

Kubernetes Service Discovery

Service discovery solves the problem of figuring out which process is listening on which address/port for which service.
In a good service discovery system:
  • users can retrieve info quickly
  • informs users of changes to services
  • low latency
  • richer definition of what the service is (not sure what this means)
The Service Object
  • a way to create a named label selector
  • created using kubectl expose
  • Each service is assigned a virtual IP called cluster IP – the system load balances across this IP all the pods identified by the same selector
Kubernetes itself creates and runs a service called kubernetes which lets the components in your app talk to other components such as the API server.
Service DNS
  • k8s inbuilt DNS service maps cluster IPs to DNS names
  • installed as a system component when the cluster is created, managed by k8s
  • Within a namespace, any pod belonging to a service can be targeted just by using the service name
Readiness Checks
The Service objects also tracks when your pods are ready to handle requests.
spec:
 
  template:
   
    spec:
      containers:
       
        name: alpaca-prod
        readinessProbe:
          httpGet:
            path: /ready
            port: 8080
          periodSeconds: 2
          initialDelaySeconds: 0
          failureThreshold: 3
          successThreshold: 1

I we add the readinessProbe section to our YAML for the deployment, then the pods created by this deployment will be checked at the /ready endpoint on port 8080. As soon as the pod comes up, we hit that end point every 2 seconds. If one check succeeds, the pod will be considered ready. However, if three checks fail in succession, it’ll not be considered ready. Requests from you application are only sent to pods that are ready.
Looking Beyond the Cluster
To allow traffic from outside the cluster to reach it, we use something known as NodePorts.
  • This feature assigns a specific port to the service along with the cluster IP
  • Whenever any node in this cluster receives a request on this port, it automatically forwards it to the service
  • If you can reach any node in the cluster, you can reach the service too, without knowing where any of its pods are running
Enable the Proactive CPU Monitoring

Proactive CPU monitoring is one of the Diagnostic tools and an easiest & proactive way to determine the cause of high CPU usage.

You can consider to enable the “Proactive CPU Monitoring” to capture the memory dump when the CPU usage is high to get more insights on that:
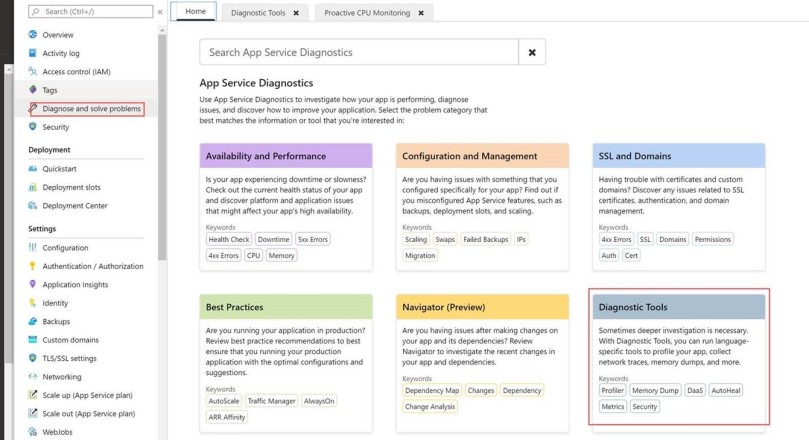
1. Go to “Diagnose and solve problems” à “Diagnostic Tools”:

2. Choose a suitable technical language à  “Proactive CPU monitoring”:
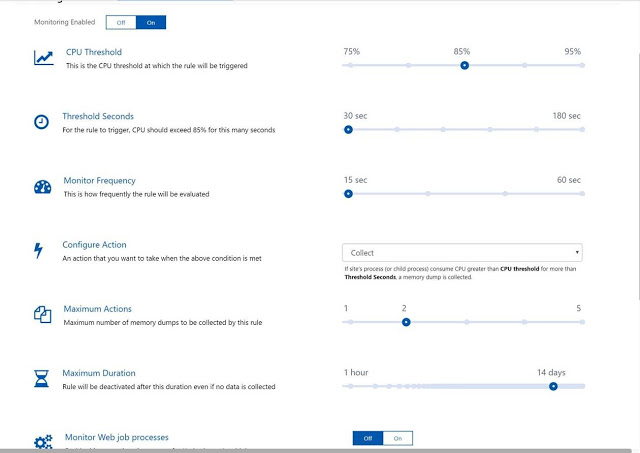
3. You can set up some rules like that:
4. Whenever the CPU usage match the above rules, the platform will capture the memory dump. 
I hope this information helped you. Feel free to contact us to discuss more. 

Azure load-balancing options

Load balancing refers to the process of distributing incoming network traffic uniformly across a group of backend server also known as server farm to optimize network efficiency, reliability and capacity.

Microsoft provides a good documentation which describes load-balancing options in Azure. Here is a quick summary of load-balancing options in Azure.

Options Azure Front Door Traffic Manager  Application Gateway Azure Load Balancer 
 Description It offers Layer 7 capabilities for your application like SSL offload, path-based routing, fast failover, caching, etc. to improve performance and high-availability of your applications. DNS-based traffic load balancer that enables you to distribute traffic optimally to services across global Azure regions, while providing high availability and responsiveness.  Provides application delivery controller (ADC) as a service, offering various Layer 7 load-balancing capabilities. Zone-redundant, high-performance, low-latency Layer 4 load-balancing service (inbound and outbound) for all UDP and TCP protocols.
OSI Layer  Layer 7 (Application Layer) Layer 7 (Application Layer) Layer 4 (Transport Layer)
Global/regional  Global  Global  Regional  Regional
Traffic type  HTTP(S)  non-HTTP(S)  HTTP(S)  non-HTTP(S)
 SLA  99.99%  99.99%  99.95%  99.99%
Routing Reverse proxy. AFD uses reverse proxy which provides faster failover support. Also uses AnyCast & Split TCP. DNS routing. DNS-based load-balancing service that operates only at the domain level.  It acts as a reverse proxy service. This terminates the client connection and forwards request to back endpoints.  This provides network level distribution but essentially only with the same azure data centre.
SSL Offload Available Available
WAF features Available Available
Caching Available

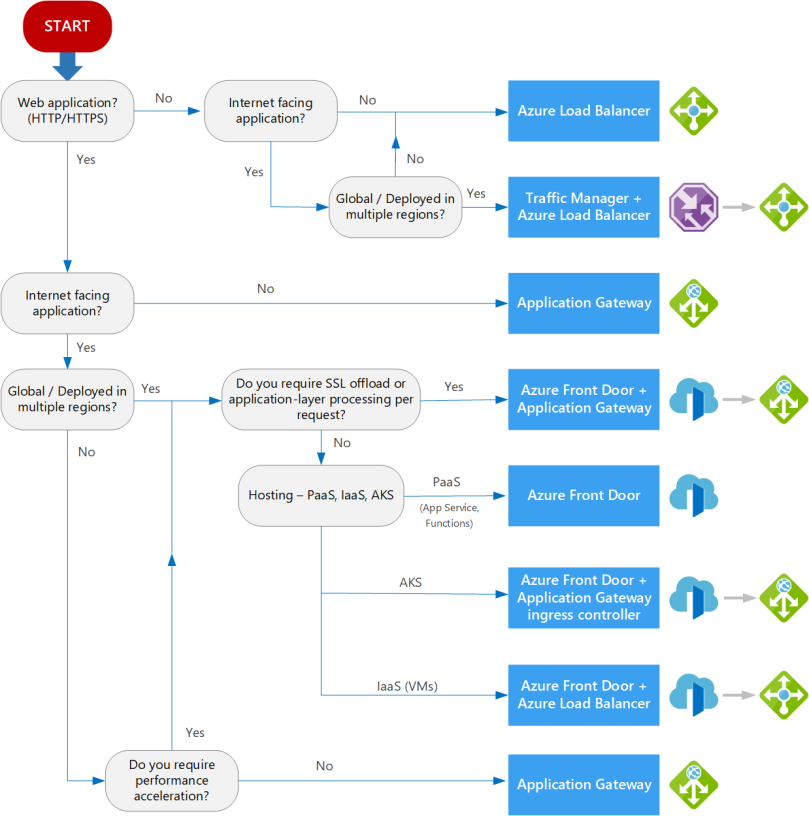
The following flowchart is really helpful to identify best load balancing option for your application.

afdtmwaflb

Source: https://docs.microsoft.com/en-us/azure/architecture/guide/technology-choices/load-balancing-overview